Here’s a psychological conundrum: We know human beings are far from perfectly rational—and in recent years, considerable progress has been made in documenting the exact contours of human fallibility. Yet despite the ever-growing list of cognitive biases—despite the fact that these biases are ever more systematic and predictable—we lack the tools to systematically and predictably correct these flaws in human judgment.
You’d think that such a thorough diagnosis of mass irrationality would lend itself to more obvious prescriptions. If you had a map of all the road closures in your area, you’d surely find an alternate (if perhaps less efficient) route. Yet so often, we can’t seem to help ourselves: Faced with an airtight argument, we double down on faith and tribalism; faced with the data in support of regular sleep and exercise, we scroll deep into the night and guzzle tubs of Häagen-Dazs; faced with a steady paycheck and 5% equity, we tell ourselves that, yes, of course dropping puppies in a blender for “research” is a noble and intellectually stimulating act that helps human society—etc., etc. Simply knowing about human biases is not enough to fight them in ourselves and others.
Put another way: When the head can irrefutably prove something is false, what does it take for the heart to actually accept the truth? That, in a nutshell, is the question this post is about.
Unfortunately, due to road closures in your area, it’s going to take a little while to get to an answer.
A Brief History of a Divided Mind
Before we proceed any further, we’ll need some common language to discuss the topic at hand. The established technical terms are those coined by renowned psychologist Daniel Kahneman: System 1 and System 2. More recently, these systems were rebranded by also-quite-famous psychologist
as the elephant and the rider. I like Haidt’s version better because they’re easier to remember, so I’ll mostly be sticking with that throughout this piece.***If the concept of the “elephant and rider” is familiar to you, now is a good time to skip ahead!***
The elephant (a.k.a. System 1) is the intuitive, automatic part of our mind—the one that, e.g., is terrified of getting bitten by a shark, or sees the bottom line below as longer:

The rider (a.k.a. System 2) is the conscious, rational mind—the one that looks up the extreme improbability of shark attacks, or gets out a ruler and holds it up to the screen in front of you.
It’s crucial to note that just because our instinctive, intuitive minds often jump to conclusions does not mean they are stupid. After all, it is the elephant in the brain that instantly tells us whether a smile is genuine, that primes us for action in response to a loud noise, and that allows us to casually merge into a new lane at sixty miles per hour. It is because of this effortless wisdom—and its relatively greater influence on decisions—that Haidt cast System 1 as the “elephant” rather than, say, a horse or donkey.
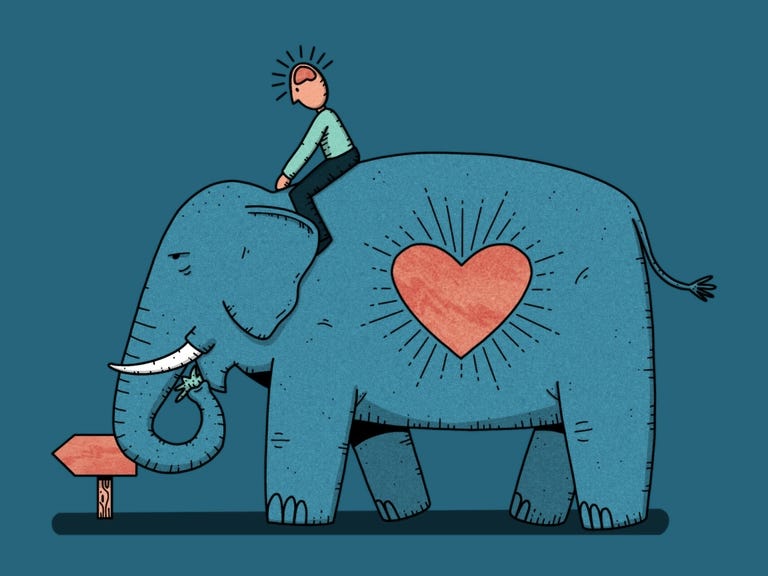
In any event, whatever you call them, it’s clear that the elephant and rider highlight a fundamental tension in human nature: the tension between knowing and believing.
How to Tame a Wild Elephant
Most of the time, we experience our rider and elephant as being in agreement. We like our apartment [says the elephant] because [says the rider] the neighborhood is nice and it gets great light. We disapprove of such-and-such candidate [says the elephant] because [says the rider] their stance on gun rights is unconscionable, they lack governing experience, and, uh, didn’t they say something homophobic once?
Of course, in reality, these “reasons” are more often than not rationalizations. (Unconsciously: We like our apartment so the neighborhood is therefore nice; we dislike such-and-such candidate so their policies are therefore bad.) This isn’t to say that the causal arrow can never run from head to heart—just that unmotivated reasoning is rare. And the elephant is all the more powerful because it cannot be reached directly.
Or can it???
In fact, while we often struggle to tame our own elephants, it is trivially easy to see the ways others fall prey to bias or manipulation. This gives us a good idea of what elephants are likely to respond to: flattery, simplicity, and bright colors (to name a few). The elephant lives in an older part of our brains—one that evolved before the frontal cortex, before abstract reasoning, before language.1 Its dominant mode of understanding is, above all, visual and associative.
In light of this, here’s my claim: Graphs are one of the few good tools we have to translate riderly knowledge into language the elephant can (somewhat) understand.
It’s hardly controversial to observe that visual information is more accessible; we’ve all had the experience of understanding in concrete, graphic presentation what was incomprehensible in its vague verbal form. Take, for example, an interactive demo like If the Moon Were Only 1 Pixel:
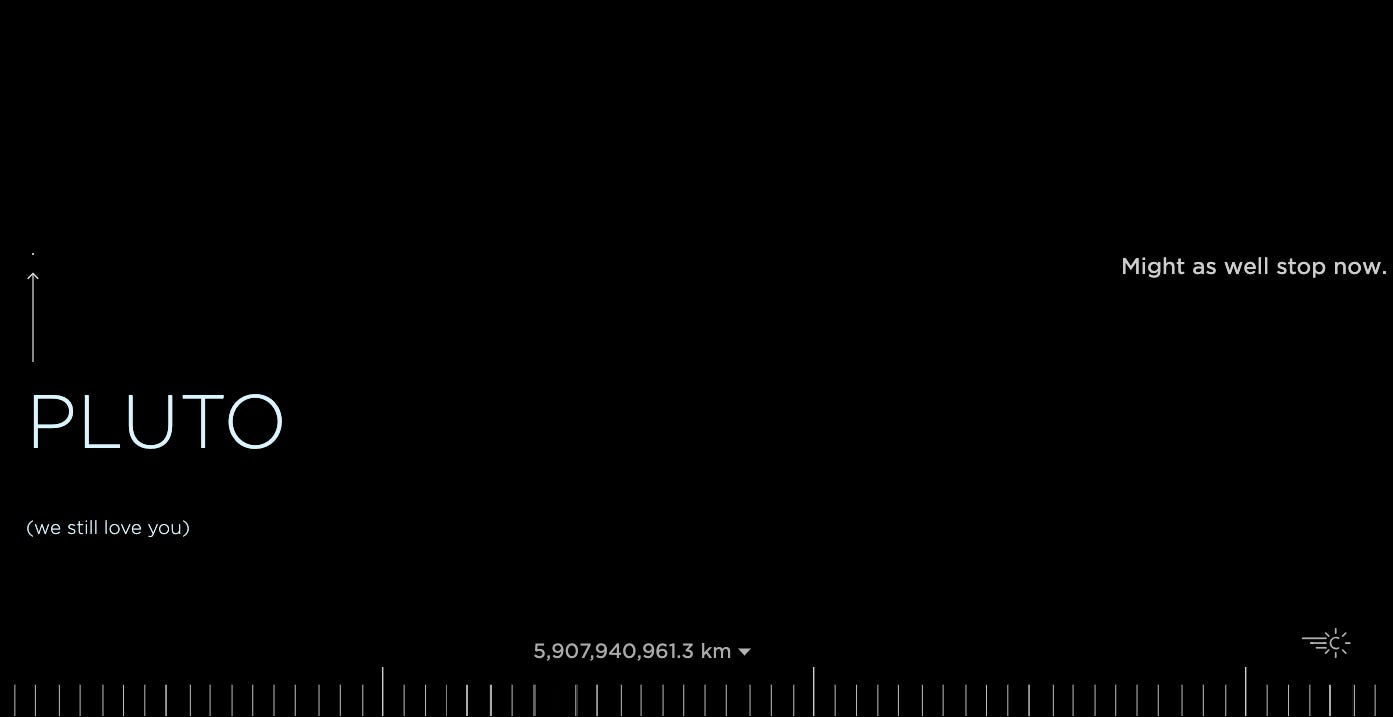
As its title suggests, this site allows you to scroll through outer space from the convenience of your living room. Of course we could simply read the distances between the planets, but our elephant-strapped minds are notoriously bad at conceptualizing scale. When we see the distances, on the other hand, we come a little closer to comprehending the true vastness of the cosmos.
Where this idea gets interesting—and, I think, less obvious—is that graphs can be useful even when the values they are based on are completely invented. To understand why, we’ll need to go back ten years, to Scott Alexander’s 2013 blog post that inspired the title of this piece: “If It’s Worth Doing, It’s Worth Doing with Made-up Statistics.”
“Sometimes Pulling Numbers Out of Your Arse and Using Them to Make a Decision is Better than Pulling a Decision out of Your Arse.”
Some decisions (i.e., simple ones where good metrics are available) are clearly the domain of the rider: You don’t determine the time of day by squinting at the sun—you check your watch.
But there are many situations where you don’t have good measurements, either because data are costly to collect or because they are simply not possible to know. In these cases, assigning rough values or probabilities to the inputs of a decision—even totally invented values—often trumps a decision based on pure intuition.
Consider, for example, a hypothetical choice between two jobs. Job A is a decent opportunity in a city you’ve always hoped to live in—but it will entail moving across the country and a higher cost of living. Job B is more of a gamble (it could be great, or it could be a total bust), in a closer, more affordable, but less appealing city.
There is no objective “right answer” here, so it’s tempting to let the elephant completely steer the decision. And of course we can’t eliminate subjectivity. What we can do, however, is demand greater exactness by breaking the problem down into a series of smaller questions. This might mean, say, assigning scores to the two jobs in four relevant categories (job quality, location, affordability, and ease of move); if some factors are more important, we can even decide in advance to weight them more heavily—say scoring job quality out of twenty points, and deprioritizing the ease of the move to five points:

It’s not that these contrived numbers are “correct”—just that they’re better than nothing. They’re good enough to be useful. (Is job quality exactly four times as important as the ease of the move? No. Is the move for Job A exactly twice as difficult as for Job B? Also no.) They’re a safeguard against getting sucked into any one consideration or pure “vibes”—yet they do ultimately spit out a total that can be held up against intuition.
This strategy is a way of checking the elephant’s holistic judgment against a series of elephant sub-decisions. After all, the rider usually isn’t strong enough to win in a test of raw strength. What the she can do, however, is narrow the elephant’s field of vision—give it some peanuts to play with while she frantically scribbles down notes on a clipboard. In the end, the elephant may still thrash her around, but at least she’s able to note inconsistencies in its behavior.
Take Me By the Trunk
If the approach I just described makes sense to you, then it shouldn’t be a huge leap from “made-up numbers are useful” to “made-up graphs are useful.” We’ve already gotten a taste for the power of the visual—and will look at several more examples in a moment. Made-up graphs are simply a way of combining the power of the visual with the insight that numerical approximations are often useful.
Let’s start with some graphs2 of real phenomena and move gradually into the territory of the invented. As we go through these examples, I’ll explain the benefits these graphs offer over the same information presented in verbal or numerical form. First up, the notorious “hockey stick graph”:
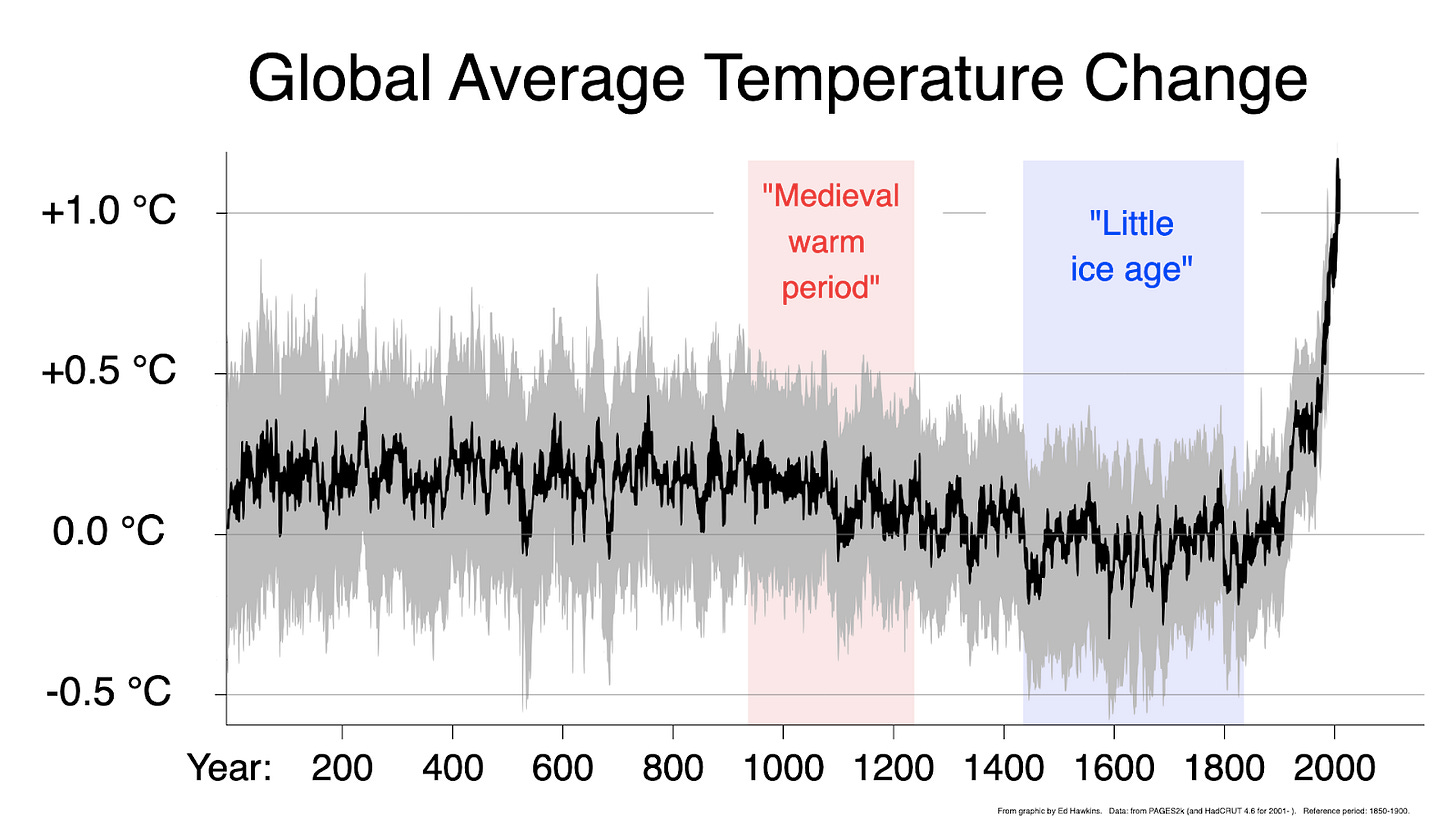
This is a famous graph (and, to be clear, a 100% real one). Like “If the Moon Were Only 1 Pixel,” it presents abstract information in simple terms the elephant can understand.3 Yes, we need the rider to make sense of what the graph means, but the sharp uptick of the line is something our visual system perceives automatically.
For a phenomenon as diffuse and invisible as global warming, this kind of direct appeal to the eyes makes a difference. Reading the sentence “Average global temperatures have gone up by about one degree Celcius in the past two hundred years” just isn’t as effective a call to action as the graph’s sharp uptick.4 This is the primary and most important justification for graphs—real or made-up—over mere words:
Reason #1: Graphs are more persuasive
Some graphs are explicitly designed to encourage a certain behavior, like the one below extolling the virtues of compound interest:
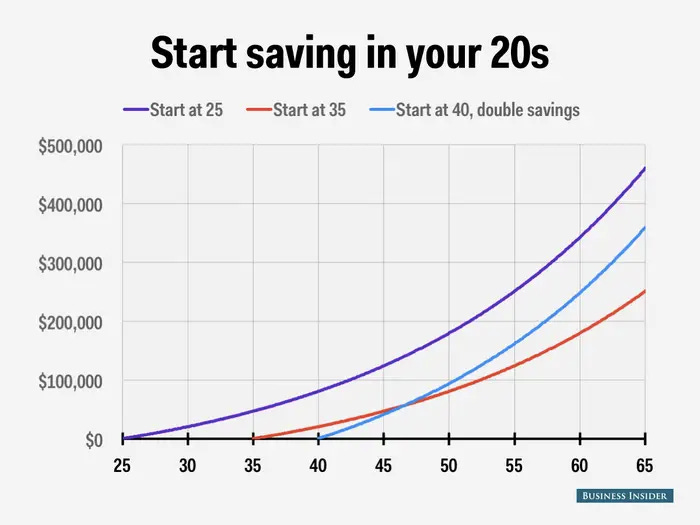
Here, we are starting to get into the realm of the made-up: The dollar amounts here are all hypothetical; in fact, even if you followed the exact savings plans prescribed, the projections would turn out to be wrong due to random fluctuations in the market.
But as with the example of choosing between two jobs, these projections are good enough to be useful. Sure, the growth rate might be a few percentage points higher or lower than the conservative 5% used here, but in the long-run it’s not going to be 50%, and it’s not going to be -50%. It’s a near-guarantee that money invested at 25 will increase more than the equivalent amount invested at 40. And like the hockey-stick graph, this image makes a much more persuasive case than the same information presented in a sentence, or even in a table:

But let’s look at some numbers that are even more made-up. After all, while the graph above is hypothetical, dollars are ultimately measurable. What happens when we start dealing with more squishy or speculative variables? Consider, for example, the graph of political polarization below:
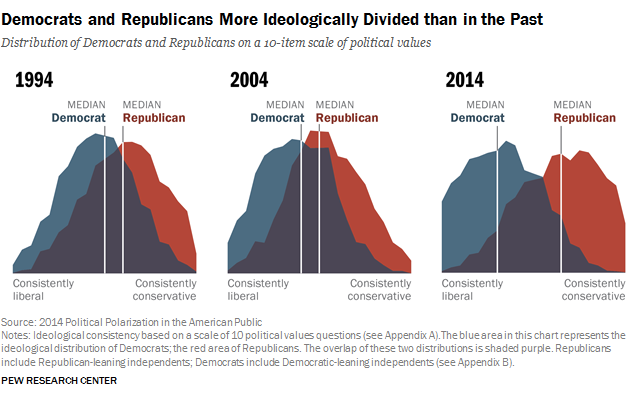
At first glance, this graph might not appear to be “made up”—but look closer. There are a lot of subjective decisions that go into making it. “Liberalism” and “conservatism,” for example, are constructs that can morph over time in response to the issues of the day. When we dig into the methods, we find that the distribution above is determined through agree/disagree items like “Government is almost always wasteful and inefficient” and “Immigrants today are a burden on our country because they take our jobs, housing, and health care.” Not only do these statements require judgment on the part of survey respondents, there is a considerable degree of subjectivity about what items are included in the survey in the first place. (I noticed, for example, that there aren’t any statements about gun rights, free speech, or abortion.)
In other words, this graph is built on certain assumptions, both by the survey creators and survey respondents. But these assumptions are, of course, reasonable assumptions, and in aggregate they reveal something useful. In fact, even though the aggregation process obscures some granular detail, it ultimately gets at the truth in a faster and more comprehensible manner. This is the second argument for (made-up) graphs:
Reason #2: Graphs communicate more efficiently
In the examples thus far, the graphs are useful because they capture ~90% of the story at a fraction of the speed. In a highly competitive, information-dense attention economy, this efficiency is essential for reaching a wide audience.
It’s also, often, a service to the audience, who doesn’t always have time to crunch the numbers. Like a baseball player practicing their ideal swing angle, the viewer of a graph can get the gist of the information in their mind’s eye without having to whip out a protractor:
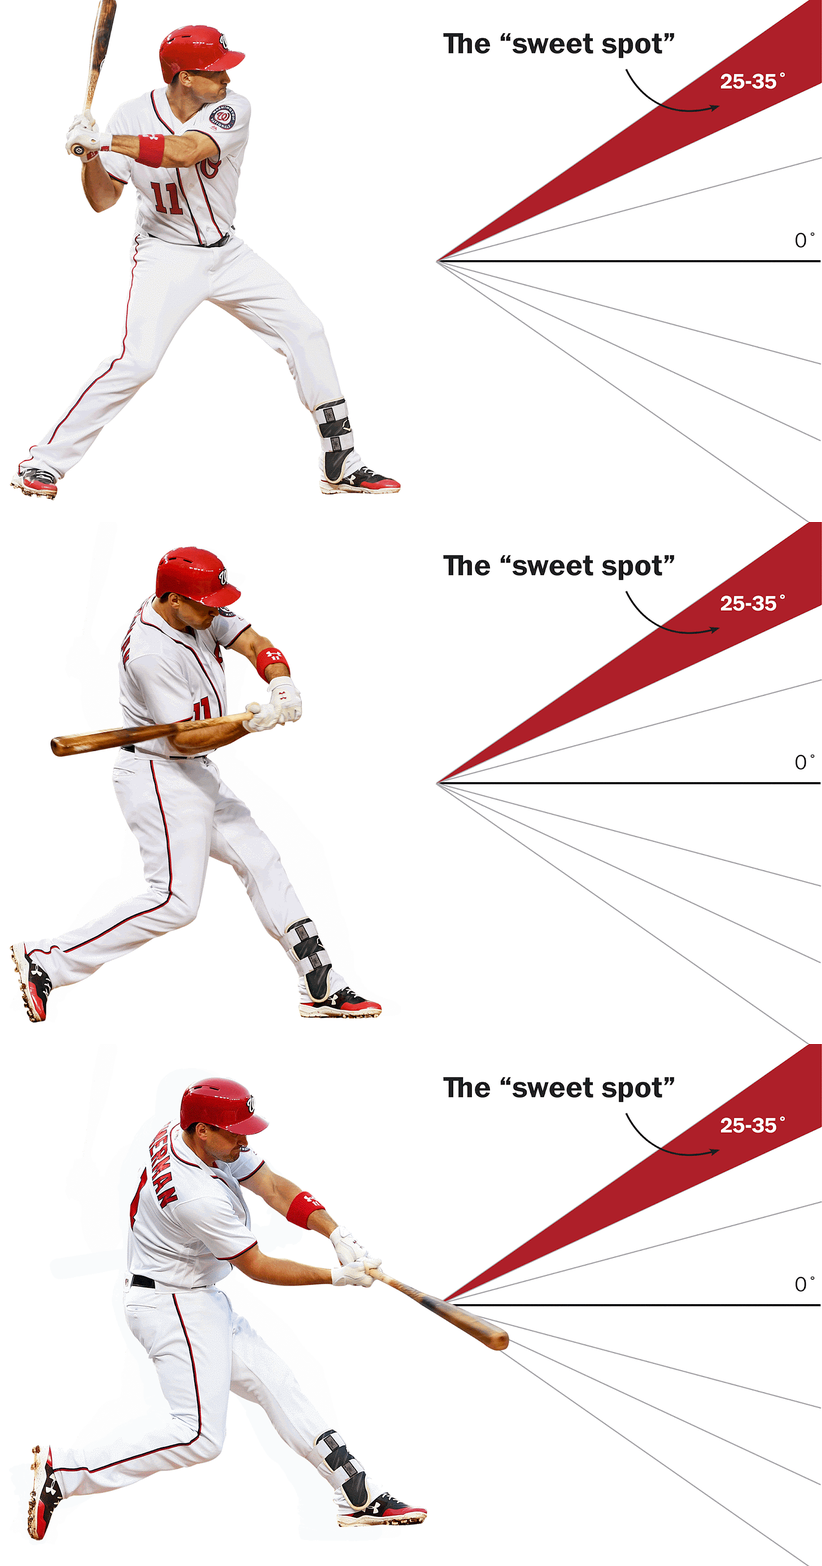
There’s a reason, in other words, that Daniel Kahneman titled his book “Thinking Fast and Slow” [emphasis mine]: While the elephant (a.k.a. System 1) is not perfect, it generates mostly-correct solutions almost instantaneously; by contrast, the rider (a.k.a. System 2) often needs several minutes with a scratch pad and calculator. In this light, graphs—even ones based on speculative or approximate values—are a way of training more rapid intuition without sacrificing much accuracy.
Speed, however, is only one marker of expertise. Another marker is what might be called depth or—as I wrote about last month—the ability to perform at a high level that which cannot be put into words. For example, consider this remarkable account of intuition related by Kahneman:
The psychologist Gary Klein tells the story of a team of firefighters that entered a house in which the kitchen was on fire. Soon after they started hosing down the kitchen, the commander heard himself shout, “Let's get out of here!” without realizing why. The floor collapsed almost immediately after the firefighters escaped. Only after the fact did the commander realize that the fire had been unusually quiet and that his ears had been unusually hot. Together, these impressions prompted what he called a “sixth sense of danger.” He had no idea what was wrong, but he knew something was wrong. It turned out that the heart of the fire had not been in the kitchen but in the basement beneath where the men had stood. [emphasis mine]
Again, we see here the advantage of the elephant’s greater speed. We also see how the elephant possesses knowledge that is not accessible to the rider. Graphs are surely no substitute for deliberate practice5—but can they help to scaffold some forms of unconscious wisdom? If so, then this suggests one final argument in their favor:
Reason #3: Graphs promote deeper pattern recognition
Deep pattern recognition means having a model of how the world works in a certain domain. Even when you aren’t consciously thinking about this model, it’s still running in the background, subtly shaping the way you think about decisions. What should you expect to happen to your business, for example, as it grows from a mom-and-pop shop to a mid-sized company to a massive corporate conglomerate?
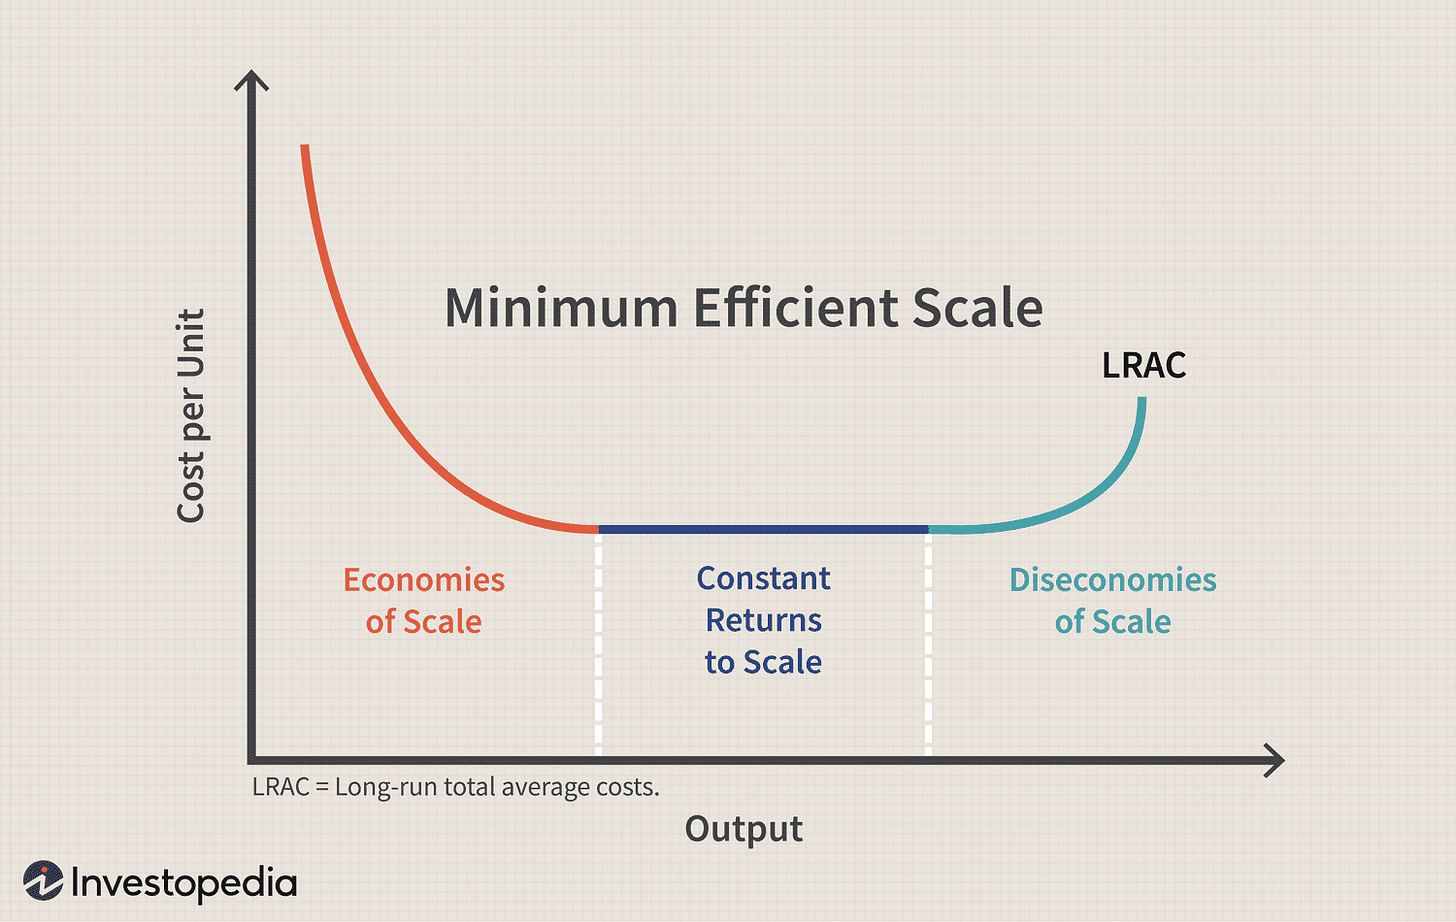
Or when you’re learning a new skill, do you expect your rate of progress increase with practice before plateauing? Or will it just continuously taper off?
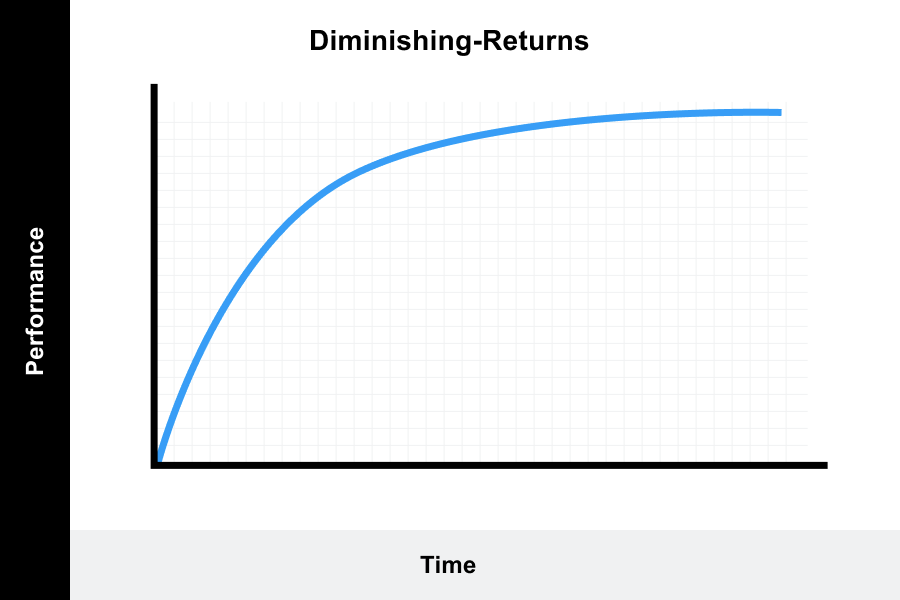
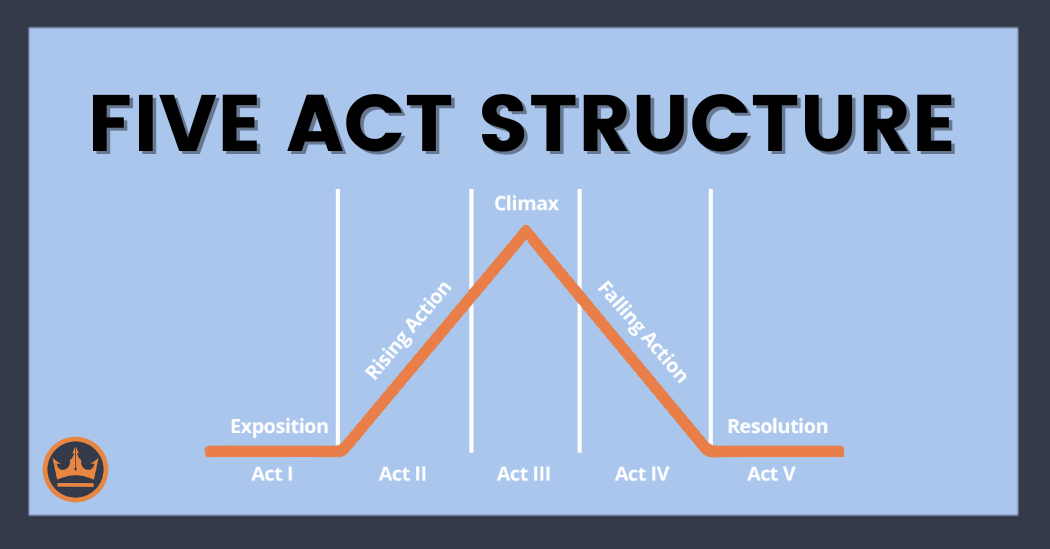
Often, our implicit answers to these questions affect not only our overt behavior but also our internal motivation. (If you expect diminishing returns to practice, it won’t come as a surprise that you have to work harder to improve.) And even when there is no objective answer, the ideal shapes we hold in our minds make a difference. A writer who has internalized Freytag’s pyramid will write one kind of story:
A writer working in another tradition might make a very different set of choices:
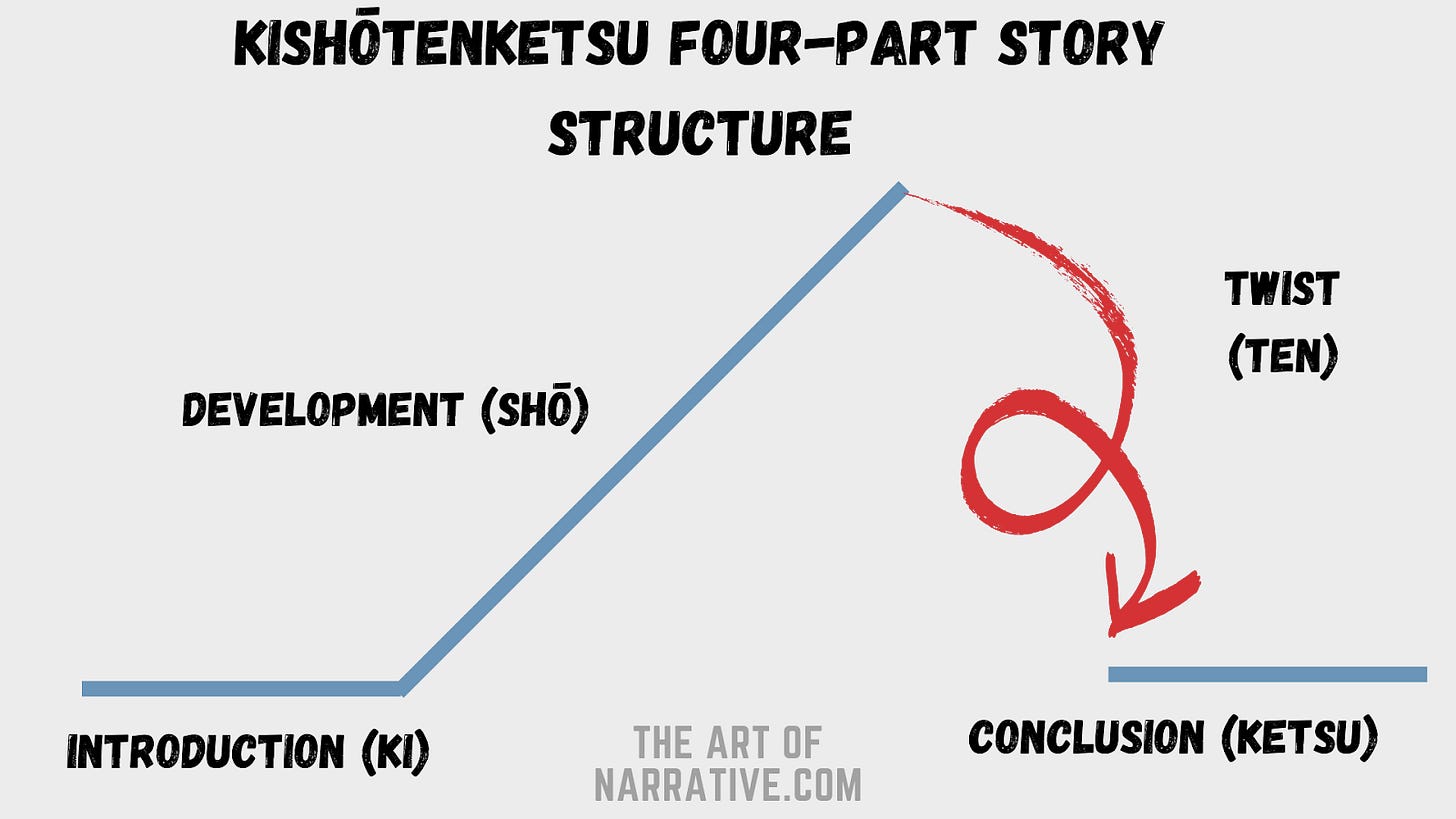
Like learning curves or the growth of a business, these story structures are simplifications of inherently messy realities—yet they still shape the end result. Somewhere in the writer’s cerebellum, an elephant is either hiking down a mountain or somersaulting off a cliff.
In short: Reasoning with made-up numbers can help us get closer to the truth. Graphing made-up numbers can help us get closer to feeling and acting on the truth.
Coda: Dreaming Our Way toward Reason
I started this post with a simple question: How can the head reach the heart when the heart won’t accept logical arguments?
Graphs provide one answer to this question. By presenting quantifiable information in a more elephant-friendly mode, they operate more persuasively, efficiently, and at a deeper level of understanding. This is true for squishy, approximate values as much as it is for real ones.
I can personally attest to the benefit of made-up graphs in my own life. In an early post called “Contentment Smoothing,” for example, I imagined treating happiness as a resource for investment and consumption; of course happiness isn’t fungible—yet in pretending it is, I’ve become more conscious of “banking” the good times to draw on in moments of stress or sadness. In “Breaking Up the S-curve,” I laid out a generalizable theory of my creative process; in doing so, I became more patient and efficient in my writing practice. In fact, this very post is a product of the S-curve model: I’m currently editing it after a long incubation period following my initial draft. Both of these made-up graphs tell a reductive and speculative story—yet both have had a tangible positive impact on my life. (George Box: “All models are wrong, but some are useful.”)
All that said, graphs are only one tool we can use to guide our elephants toward greater rationality and effectiveness.6 Other essential tools include art, humor, games, and nudges—a broadly humanistic and “softer” set of approaches. These tools aren’t a replacement for evidence or logical coherence; rather they’re an acknowledgment that rational ends can and must be achieved at times through non-rational means.7 When we struggle to act in a manner consistent with the facts, when we struggle to win others to our side, it’s usually not more data we need; it’s an elephant whisperer. Indeed, even Einstein, after reaching the riderly conclusion that existing theories were incoherent, needed his elephant to actually crack the puzzle. As science writer Annie Murphy Paul describes:
The world’s most famous physicist…reportedly imagined himself riding on a beam of light while developing his theory of relativity. “No scientist thinks in equations,” Einstein once claimed. Rather, he remarked, the elements of his own thought were “visual” and even “muscular” in nature.
Of course, we can’t all be Einstein. What we can do is strive to be realistic about the nature of the human animal. After all, when head and heart collide, it often doesn’t matter if the head is right—the heart is too powerful, too prone to stampedes. Instead, the head must learn to call on the heart’s vast, primal intelligence; to trumpet its wordless music; to conjure shapes as old as the horizon.

Thanks to Charlie for notes on this post.
Through repetition, the elephant can recognize words and short phrases, as evidenced by how you automatically complete the blank in “peanut butter and ______.” Such ingrained associations quickly break down with longer strings of words, however, which require active riderly processing.
I’m using “graph” loosely to mean “a picture of some numbers.” If you prefer, here’s a stab at a more formal definition: A visual representation of physical or mental phenomena along some scale(s), often depicting the relationship between two or more such phenomena.
Technically, “If the Moon Were Only 1 Pixel” is also a graph in the traditional meaning of the word. It just has a realllly long x-axis.
Climate change skeptics might object that the scale of this graph has been manipulated to make the temperature change look more dramatic than it is. I can’t weigh in on how severe one degree Celsius actually is, but for our purposes the very fact that people argue about the manipulation of axes is proof that, with graphs, something deeper is going on beyond just the objective presentation of the data.
Kahneman again: “Whether professionals have a chance to develop intuitive expertise depends essentially on the quality and speed of feedback, as well as on sufficient opportunity to practice.”
Some have suggested a third element in the elephant and rider analogy: the path. While the rider cannot easily persuade the elephant in the moment, they can construct environments that nudge it toward closer alignment with the rider’s goals. I think this is basically in line with the approach I’m advocating.
Note that non-rational doesn’t necessarily mean irrational; it often simply means arational—i.e., having no relationship to rationality at all, hostile or friendly.


